Get Markers
This example will explain how to retrieve markers from a existing clickpoints database and use them for evaluation. The example database contains three images with markers of two different types (“adult” and “juvenile”).
First two simple examples explain how to receive the data from the database, then two examples also show how to plot the data, and finally one example shows how to add markers to a database.
[1]:
%matplotlib inline
import matplotlib.pyplot as plt
import numpy as np
import clickpoints

# load the example data
clickpoints.loadExample("king_penguins")
Get Markers By Image
Iterave over the images using getImages() to get Image objects. Then query the Marker objects for each image and for the “adult” marker types (see getMarkers())
[2]:
# open the database
with clickpoints.DataFile("count.cdb") as db:
    # iterate over images
    for index, image in enumerate(db.getImages()):
        # get the "adult" markers of the current image
        markers = db.getMarkers(image=image, type="adult")
        # print the results
        print("image:", image.filename, "\t", "adult penguins:", markers.count())
image: 20150312-110000_microbs_GoPro.jpg         adult penguins: 345
image: 20150408-150001_microbs_GoPro.jpg         adult penguins: 159
image: 20150514-110000_microbs_GoPro.jpg         adult penguins: 52
Or we can get the positions of each juvenile penguin in each image as a Nx2 array, by converting the response of getMarkers() to an array.
[3]:
# open the database
with clickpoints.DataFile("count.cdb") as db:
    # iterate over images
    for index, image in enumerate(db.getImages()):
        # get the "adult" markers of the current image
        markers = db.getMarkers(image=image, type="juvenile")
        # convert the result to an array
        markers_array = np.array(markers)
        # print the results
        print("image:", image.filename, "\t", "juvenile penguin positions:", markers_array.shape)
image: 20150312-110000_microbs_GoPro.jpg         juvenile penguin positions: (219, 2)
image: 20150408-150001_microbs_GoPro.jpg         juvenile penguin positions: (223, 2)
image: 20150514-110000_microbs_GoPro.jpg         juvenile penguin positions: (215, 2)
Get All Markers
We can iterate over all markers and get the image filename and its position.
[4]:
# open the database
with clickpoints.DataFile("count.cdb") as db:

    # get all markers without any filtering
    markers = db.getMarkers()

    # iterate over all markers (limit here to the first 10 to keep the print short)
    for marker in markers[:10]:
        # get the image assigned to the marker (and print its filename)
        # get the type assigned to the marker (and print its name)
        # and print x and y position of the marker
        print(marker.image.filename, marker.type.name, marker.x, marker.y)
20150312-110000_microbs_GoPro.jpg adult 327.59827813855543 649.337656021798
20150312-110000_microbs_GoPro.jpg adult 333.6240512981161 623.7281200936649
20150312-110000_microbs_GoPro.jpg adult 316.7518864513461 592.3940996639491
20150312-110000_microbs_GoPro.jpg adult 331.8163193502479 562.2652338661454
20150312-110000_microbs_GoPro.jpg adult 353.8103913826446 594.5031202697953
20150312-110000_microbs_GoPro.jpg adult 375.5031747570632 565.2781204459258
20150312-110000_microbs_GoPro.jpg adult 378.8173499948216 631.8629138590718
20150312-110000_microbs_GoPro.jpg adult 399.90755605328417 605.9520892729607
20150312-110000_microbs_GoPro.jpg adult 369.17611293952444 692.7232227706352
20150312-110000_microbs_GoPro.jpg adult 329.40601008642363 685.1910063211843
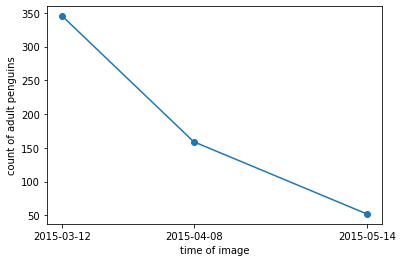
Plot Marker Count
[5]:
# initialize empty lists
marker_count = []
image_timestamp = []

# open the database
with clickpoints.DataFile("count.cdb") as db:

    # iterate over images
    for index, image in enumerate(db.getImages()):

        # get the "adult" markers of the current image
        markers = db.getMarkers(image=image, type="adult")

        # store the timestamp and marker count each in a list
        image_timestamp.append(image.timestamp)
        marker_count.append(markers.count())

# plot the lists
plt.plot(image_timestamp, marker_count, "o-")

# label the plot
plt.xticks(image_timestamp)
plt.xlabel("time of image")
plt.ylabel("count of adult penguins")
plt.show()
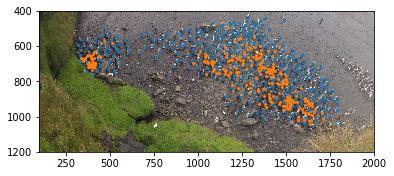
Plot Marker Positions
Now we want to plot an example image with the image and the markers as points in the image.
We can now use getImage() to get the first image of the sequence and load the data from this file. This can now be displayed with matplotlib. Then we use the image and type keyword of the getMarkers() function to filter out only markers from this image and the given type.
[6]:
# open the database
with clickpoints.DataFile("count.cdb") as db:
    # get the first image
    im_entry = db.getImage(0)

    # we load the pixel data from the Image database entry
    im_pixel = im_entry.data

    # plot the image
    plt.imshow(im_pixel)

    # get the adults positions in the image and convert it to an array
    adult_positions = np.array(db.getMarkers(image=im_entry, type="adult"))
    # plot the coordinates of the markers
    plt.plot(adult_positions[:, 0], adult_positions[:, 1], 'C0o', ms=2)


    # get the juveniles positions in the image and convert it to an array
    juvenile_positions = np.array(db.getMarkers(image=im_entry, type="juvenile"))
    # plot the coordinates of the markers
    plt.plot(juvenile_positions[:, 0], juvenile_positions[:, 1], 'C1o', ms=2)

    # zoom into the image
    plt.xlim(100, 2000)
    plt.ylim(1200, 400)
    plt.show()
Add Markers
Here, we create a new database (open in write mode “w”, which creates a new database) and add all images we find in the current folder to it (setImage()).
To add markers to the image, we first need to define a marker_type (setMarkerType()). Then we add markers to each image (setMarkers()). In this case for demonstration purposes, we just add the markers at random positions.
[7]:
from pathlib import Path

# open the database
with clickpoints.DataFile("result.cdb", "w") as db:

    # add a marker type we want to use for adding markers
    # it has the name "nosie" and the color "#FF0000", e.g. red
    # make it a type for normal markers (default)
    marker_type = db.setMarkerType(name="noise", color="#FF0000", mode=db.TYPE_Normal)

    # find all images in the folder and iterate over them
    for image_filename in Path(".").glob("*_microbs_GoPro.jpg"):

        # add the image to the database
        im = db.setImage(image_filename)

        # draw some random position where we want to add markers
        x, y = np.random.rand(2, 10)

        # add the marker positions to the image with the given marker type
        # instead of giving the marker type, we could also just provide its name "noise"
        db.setMarkers(image=im, x=x, y=y, type=marker_type)