Count Animals
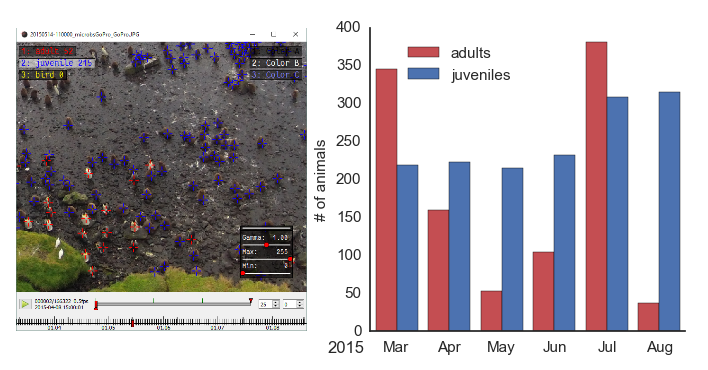
Left: image of clickpoints to count penguins. Right: number of penguins counted.
In the example, we show how the ClickPoints can be used to count animals in an image.
The example contains some images recorded with a GoPro Hero 2 camera, located at the Baie du Marin King penguin colony on Possession Island of the Crozet Archipelago [Bohec137]. Two marker types, “adult” and “juvenile” where added in ClickPoints to count two types of animals.
The the counts can be evaluated using a small script.
Open the the database where the animals were clicked.[2]:
%matplotlib inline
import matplotlib.pyplot as plt
import clickpoints

# open database
db = clickpoints.DataFile("count.cdb")
path count.cdb
Open database with version 18
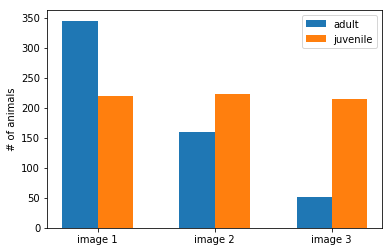
Iterave over the images using getImages() to get Image objects. Then query the Marker objects for each image and for the two marker types (see getMarkers())
[3]:
# iterate over images
for index, image in enumerate(db.getImages()):
    # get count of adults in current image
    marker = db.getMarkers(image=image, type="adult")
    bar1 = plt.bar(index-0.15, marker.count(), color='C0', width=0.3)

    # get count of juveniles in current image
    marker = db.getMarkers(image=image, type="juvenile")
    bar2 = plt.bar(index+0.15, marker.count(), color='C1', width=0.3)

# add labels
plt.ylabel("# of animals")
plt.xticks([0, 1, 2], ["image 1", "image 2", "image 3"])
# add a lagend
plt.legend((bar1[0], bar2[0]), ("adult", "juvenile"))
# display the plot
plt.show()
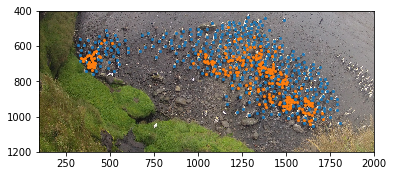
Now we want to plot an example image with the image and the markers as points in the image.
We can now use getImage() to get the first image of the sequence and load the data from this file. This can now be displayed with matplotlib. Then we use the image and type keyword of the getMarkers() function to filter out only markers from this image and the given type.
[4]:
# get the first image
im_entry = db.getImage(0)

# we load the pixel data from the Image database entry
im_pixel = im_entry.data

# plot the image
plt.imshow(im_pixel, cmap="gray")

# iterate over the adults in the image
for marker in db.getMarkers(image=im_entry, type="adult"):
    # plot the coordinates of the marker
    plt.plot(marker.x, marker.y, 'C0o', ms=2)

# iterate over the juveniles in the iamge
for marker in db.getMarkers(image=im_entry, type="juvenile"):
    # plot the coordinates of the marker
    plt.plot(marker.x, marker.y, 'C1o', ms=2)

# zoom into the image
plt.xlim(100, 2000)
plt.ylim(1200, 400)
plt.show()
References
Celine Le Bohec. Programme 137 ‘ecophy-antavia’ of the french polar institute paul-emile victor (ipev).